
Tracking set points and how they impact performance
The Manager Navigator tab provides an overview of the tracked objectives and their impact on the performance of the production line.
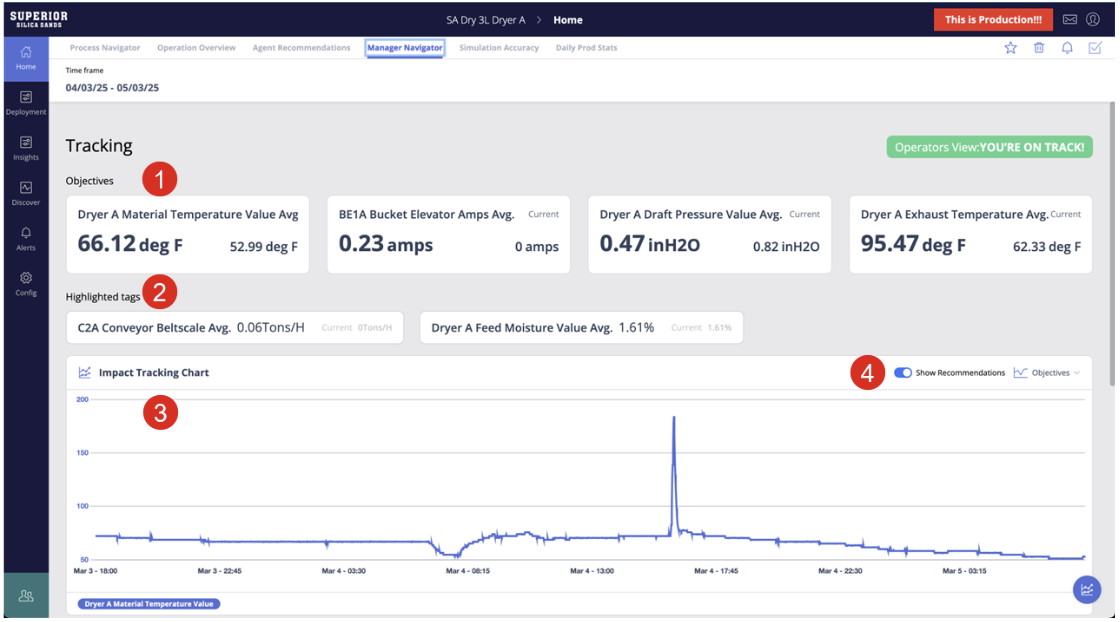
- The objectives section shows the average value for each set point during the period selected on the top bar.
- Using tags, you can highlight important settings for your site for operators to monitor, but they aren't objectives, and the Process Navigator doesn't optimize them.
- There are a series of graphs for each set point showing the value at set times.
- If you select to show recommendations, you’ll see when they were issued and how they affected the objectives.
Reviewing operator actions for recommendations
Scroll down to see a list of the published recommendations and how the operator acted.

- The recommendation execution shows the number of recommendations accepted.
- You can see the average time it took an operator to review the recommendations.
- You can also see the average time it took an operator to take an action. The time for each recommendation is shown in the table.
The table provides information for each set of recommendations. - Under Actions, you can see how many recommendations were made and how many of these were accepted.
- Under Status, you can see how the operator reacted to each recommendation.
- If the operator provided a reason for the action taken (mostly when rejected), you can see it in the Comments column.
- Click the AI button to see the recommendations.
- Click the graph button to see how the main objectives performed before and after the action was taken.
Download a PDF of this article by clicking on the attachment below.
Was this article helpful?
Be the first one to vote!
Loading